Docker for Bootcamps 3 -- Debugging
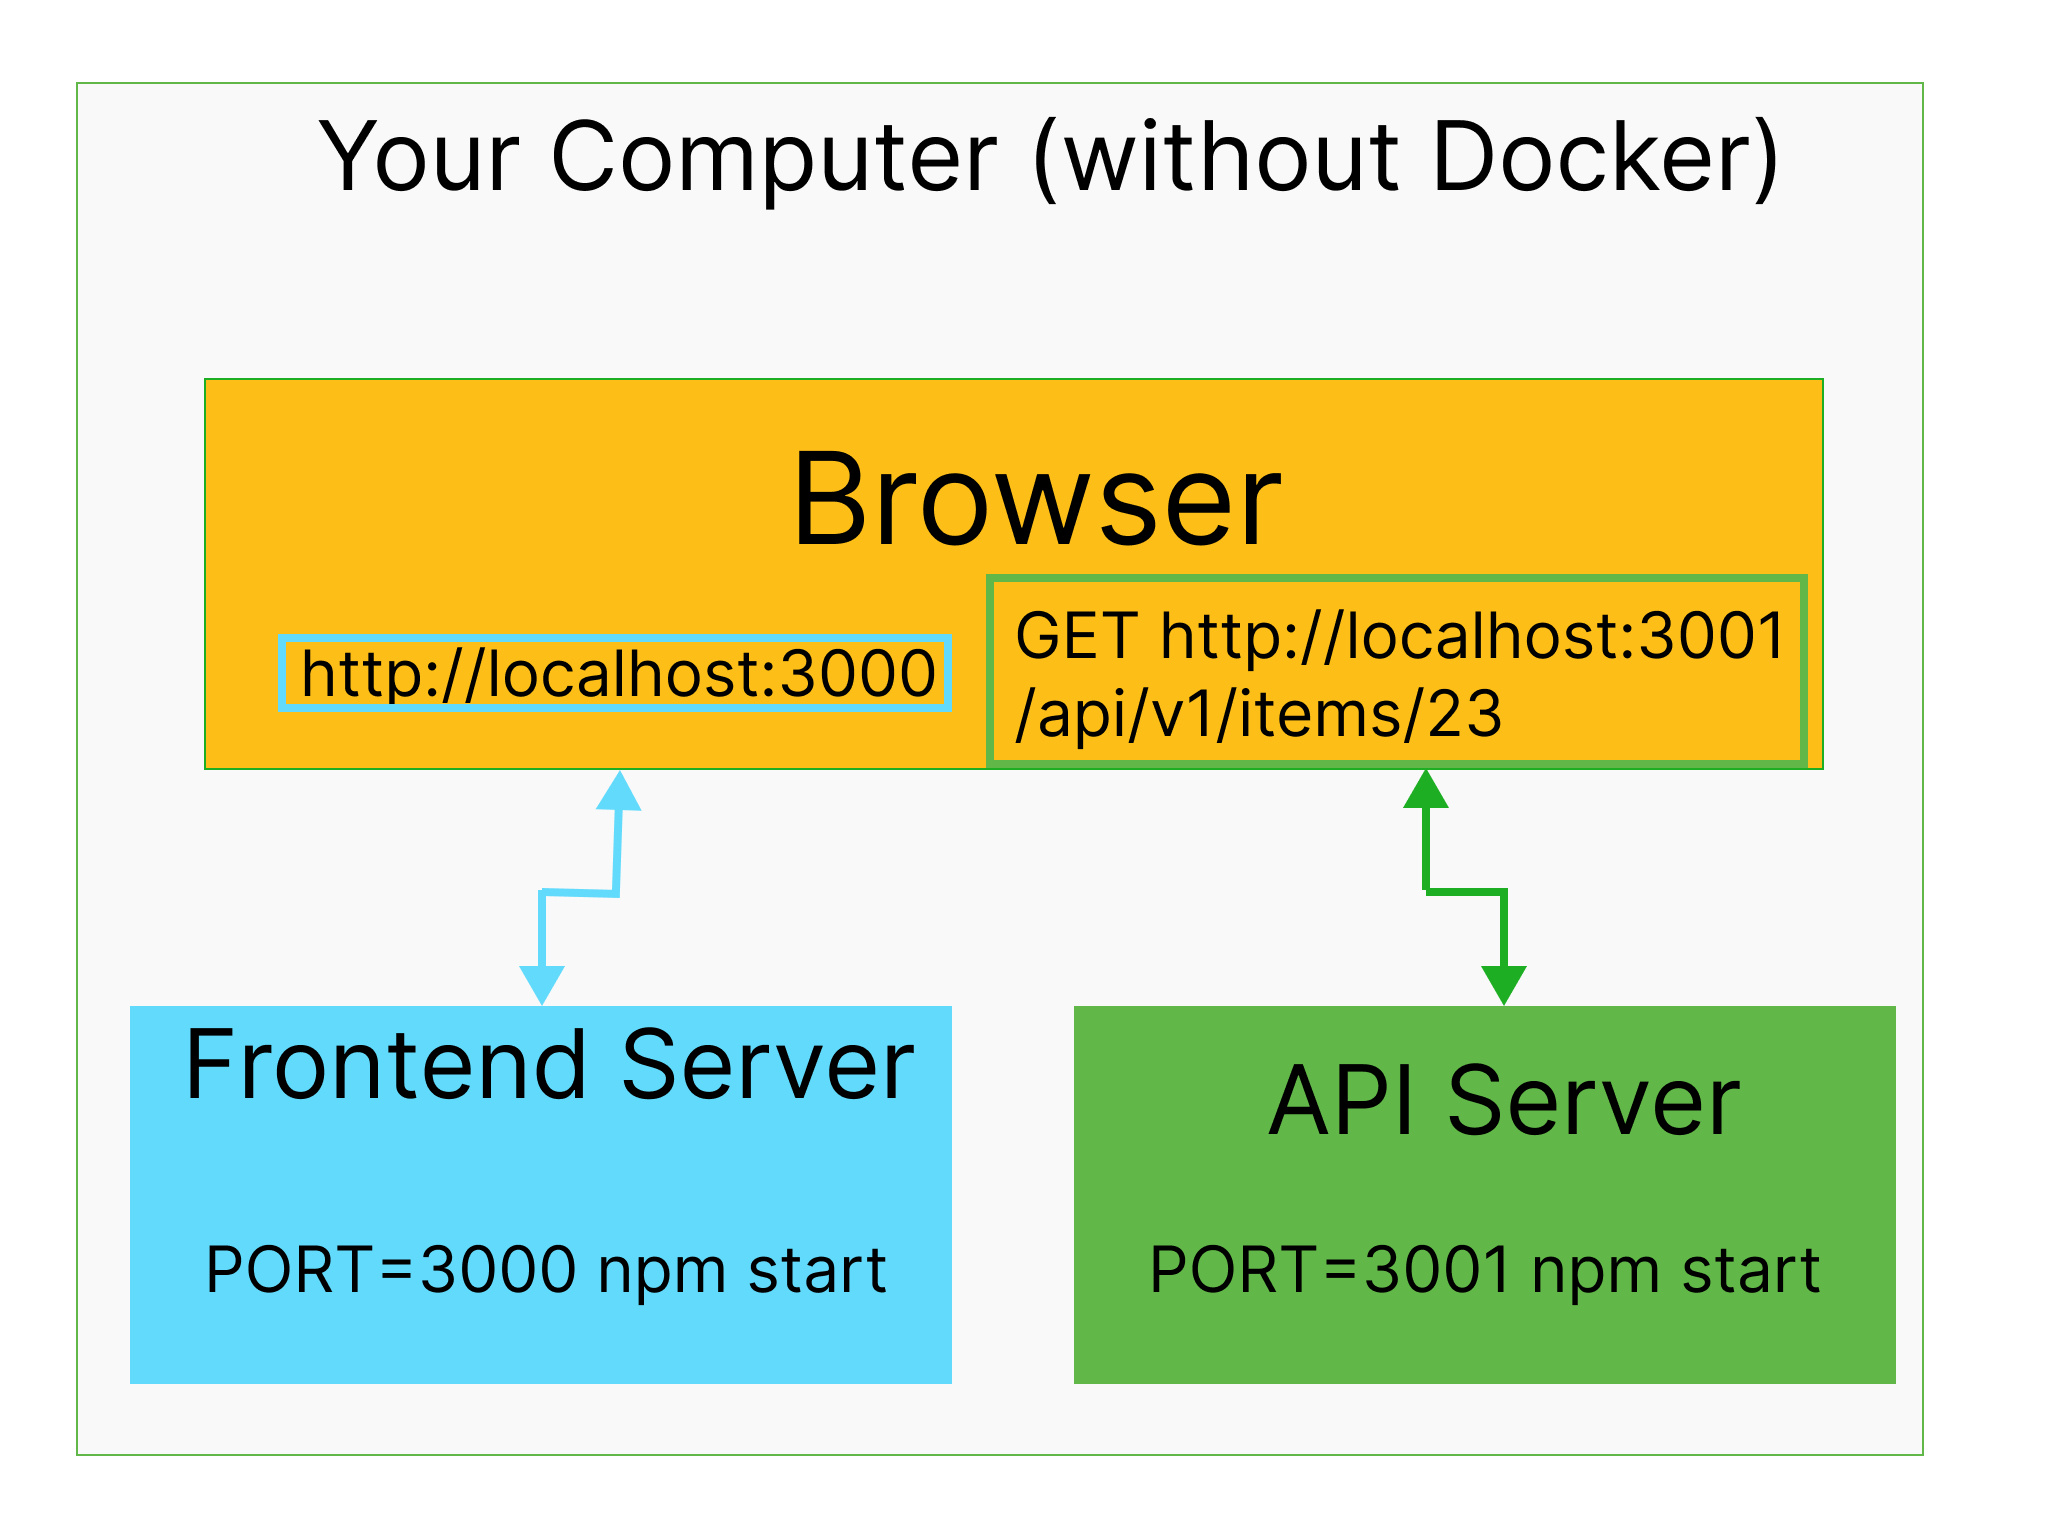
In the last two posts we went from this…
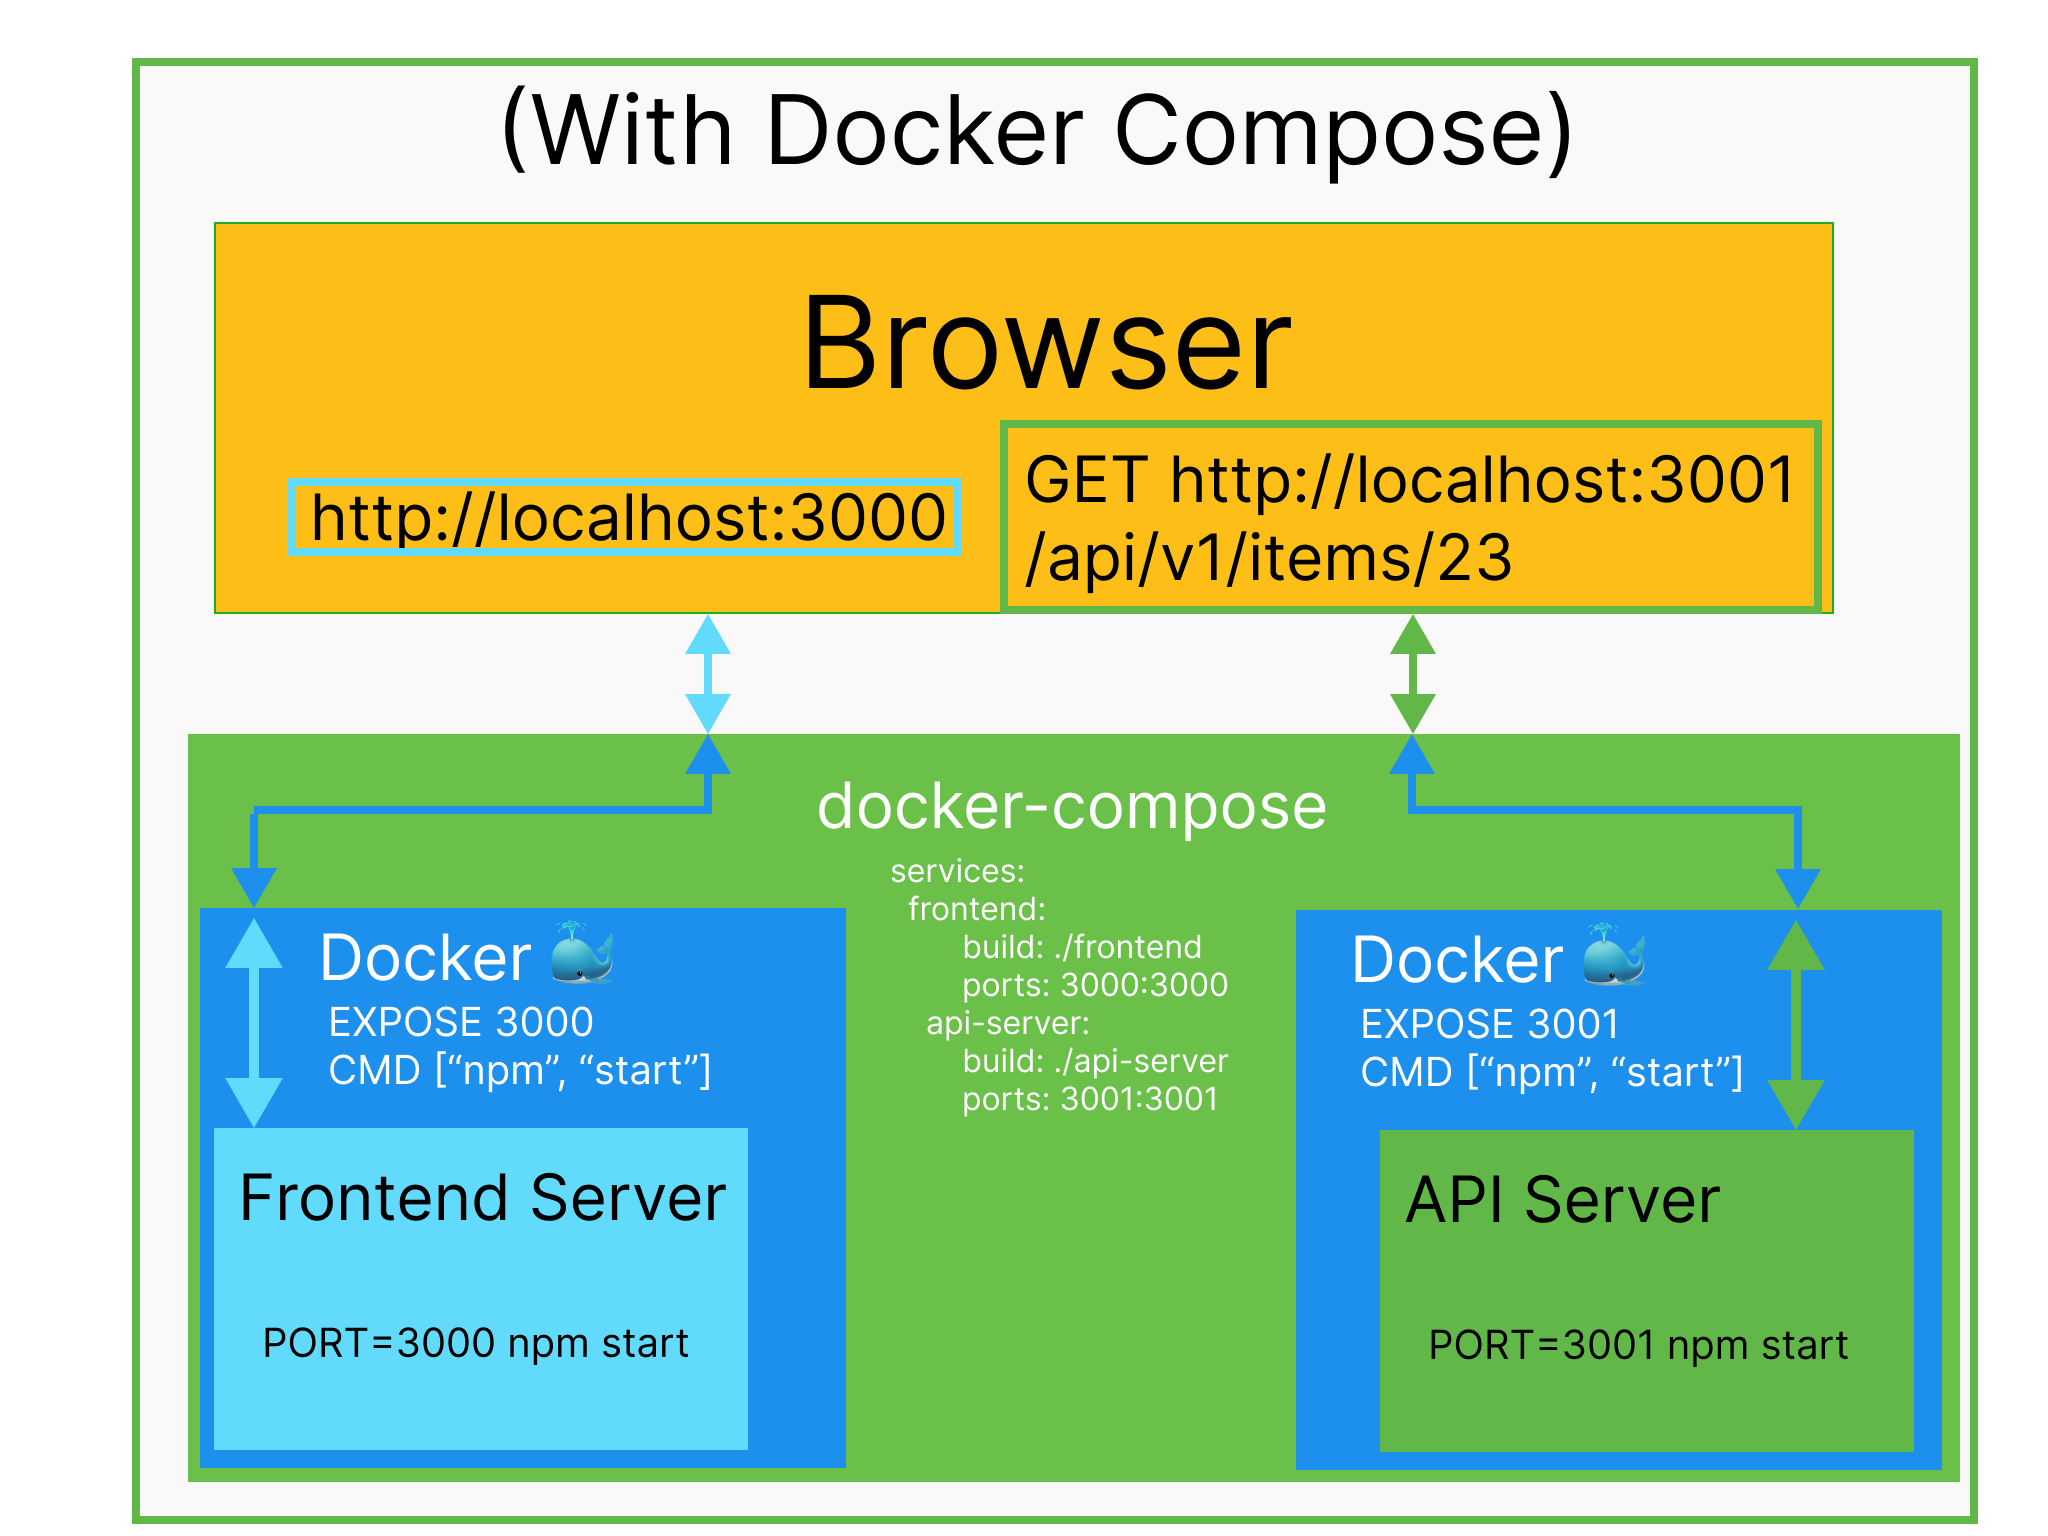
To this…
It’s a lot of complexity, but what did we gain? And is there anything we’ve lost?
First, we have an automated setup for our app. No need to worry about which version of node we have, or forgetting to npm install, Docker takes care of it all with docker compose up.
But we have lost something too. It’s hard to see into the instances in case something goes wrong. In the first case, we could just run npm start from a debugging terminal in VSCode, and run our debugger automatically. Can we find a way to do that with Docker?
Debugging Node outside of Docker
First, lets see how debugging works with Node.js. If you run…
node --inspect index.js
or
node --inspect-brk index.js
Node will start up and listen for a debugger to attach on port 9229. There is a debugger build into Chrome which you can access by navigating to chrome://inspect.
Under Devices > Remote Target, you will see a node instance you can connect to if you’ve started one with --inspect or --inspect-brk.
You can also set this up VSCode using the lanch.json file.
VSCode Dev Containers
When I began looking for a way to debug, I thought the best way would be to expose the node instance that is within the container to the outside and connect to that with a debugger. Actually, the best way is to run the container in VSCode with Dev Containers, so Dev Containers can run VSCode in the container. Then Dev Containers connects your VSCode to VSCode in the container so you can have full access to the container. You can read all about it yourself here. It is well written and it ends up working fantastically well. Thanks, VSCode!
With Dev Containers installed, the bottom left corner of VSCode will have a green >< symbol. Click on it. Then you must choose one of the options. I like to use “Reopen in a container.” This will set off the process of opening VSCode inside the container so you can run the debugger and set breakpoints.
Opening your project in Docker in VSCode
VSCode can launch your project and attach a debugger. But there is some configuration you may need. That means more things to understand before configuring. Lets look into this a bit deeper.
https://code.visualstudio.com/docs/devcontainers/tutorial
VSCode Dev Containers Options
VSCode may ask you for a “workspace” when you open in container. For us this will be /app.
devcontainer.json
After you have opened your dev container a few times and have begun to establish a workflow, you may find yourself needing to automate something or install more tools in the container. Since the container is ephemeral, you will need to store these configurations outside of you container. That place is devcontainer.json.